
If you pride yourself on your SQL optimization skills, then this is a good time to advance your MySQL performance tuning.
For one thing, MySQL has spent the last seven years as a very close #2 in the race with #1- Oracle and #3- Microsoft SQL Server, according to DB-Engines.
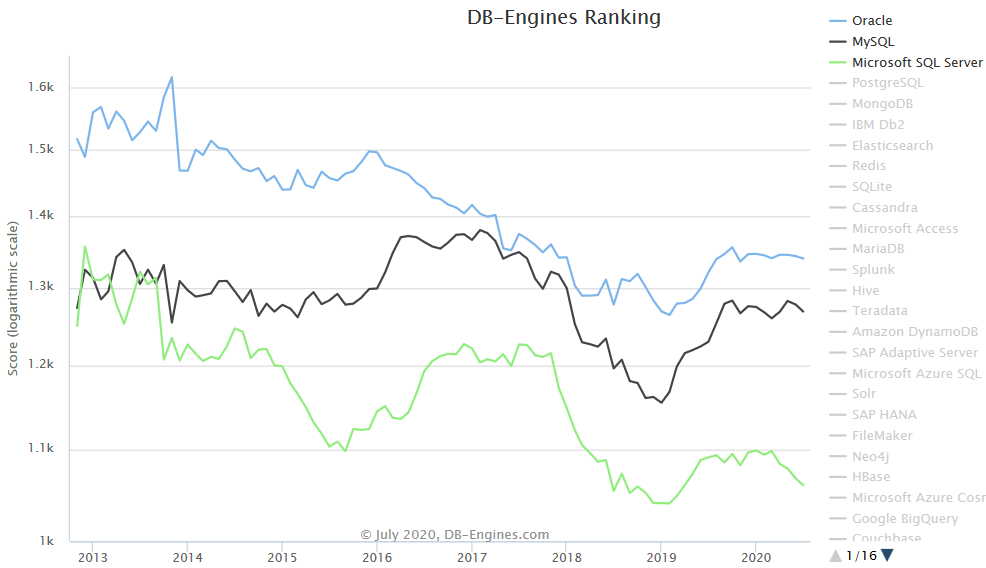
For another, MySQL is an open-source database, something you can’t say about #1 or #3. If you and your fellow database professionals are gravitating toward open-source, MySQL is currently the one to beat. It’s available on FreeBSD, Linux, OS X, Solaris and Windows. It supports almost 20 different programming languages, from Ada to Tcl, which means it has something for just about every developer.
And, MySQL has made recent news by changing obsolete terminology written into its source code and documentation. Their creators and engineers are paying attention.
The need for MySQL performance tuning
But even with the #2 database, you can still write inefficient SQL statements and launch queries that run slowly. For that, there’s MySQL performance tuning, which I’ll describe in the five tips below.
Tip 1: Monitor wait time
How long are your users waiting for a response from the database? MySQL provides wait events and thread states to help you answer that question. By monitoring each step that a SQL statement takes in the database until it sends back a response, you draw a clear picture of where the query spends time. And that’s where you start your MySQL performance tuning.
In early versions of MySQL, you couldn’t look at the Performance_Schema database or the Information_Schema database without causing locking or affecting performance. Nowadays, MySQL offers better information on both current and historical events at the levels of statements, stages and waits. For example, the number of tables in Performance_Schema that you can query for tuning information grew from 17 to 87 between versions 5.5 and 5.7. Version 8 includes a transactional data dictionary for the database objects (you’ll query those in Tip 3) that used to be stored only in underlying files.
Query for wait time data
Start your MySQL performance tuning with this query on the main tables associated with wait time:
INSERT INTO wta_data SELECT t.processlist_id AS conn_id , t.processlist_user AS user , t.processlist_host AS host , t.processlist_db AS db, LOWER(t.processlist_state) AS state, t.processlist_info AS current_sql, MD5(t.processlist_info) AS current_sql_md5, t.processlist_command AS command, w.event_id AS wait_event_id, w.end_event_id AS wait_event_end_id, w.event_name AS wait_event_name, w.operation AS wait_operation, w.object_schema AS wait_schema, w.object_name AS wait_object_name, w.object_type AS wait_type, w.index_name AS wait_index, s.sql_text AS statement_sql, MD5(s.sql_text) AS statement_sql_md5, CASE WHEN RIGHT(s.digest_text, 3)= '...' THEN 1 ELSE 0 END AS statement_digest_truncated, s.digest AS statement_digest, s.event_id AS statement_event_id, s.end_event_id AS statement_event_end_id, conn.attr_value AS program_nameFROM performance_schema.threads AS t LEFT JOINperformance_schema.events_waits_current AS w ON w.thread_id = t.thread_idAND w.end_event_id IS NULL AND w.event_name <> 'idle'LEFT JOIN performance_schema.events_statements_current AS s ON s.thread_id= t.thread_id AND s.digest IS NOT NULLLEFT JOIN (SELECT processlist_id, GROUP_CONCAT(attr_value ORDER BYattr_name DESC SEPARATOR '~^~') attr_valueFROM performance_schema.session_connect_attrs WHERE attr_name IN('program_name','_client_name') GROUP BY processlist_id ) connON t.processlist_id = conn.processlist_idWHERE t.instrumented = 'YES' AND t.processlist_id <> connection_id()AND (t.PROCESSLIST_COMMAND <> 'Sleep');Notice that the query excludes threads containing aSleepcommand and those with a wait event ofidle.
To study wait time, run that query repeatedly at some interval — say, one minute — and save the results to a table (here, wta_data).
Find the queries that are spending the most time in the database
Now run a query that groups the data by sql_text, wait_operation and time_in_seconds for each wait event, then sums the total time the query spends.
select w.sql_text, w.wait_operation, w.time_in_seconds, tot.tot_time from(select substr(current_sql, 1, 60) sql_text, wait_operation, count(*) time_in_seconds from wta_data w group by substr(current_sql, 1, 60), wait_operation) w c(select substr(current_sql, 1,60) sql_text, count(*) tot_time from wta_data group by substr(current_sql, 1,60)) totwhere w.wait_operation is not nulland w.sql_text = tot.sql_textorder by tot.tot_time, time_in_seconds;
Then, examine the query output (this is from a sample database for a rental company):
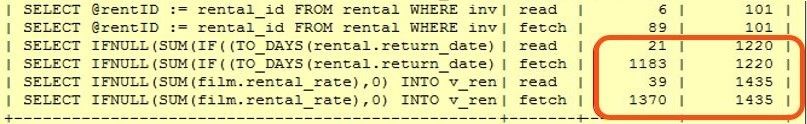
The middle two rows reveal that one SQL statement spent 21 seconds on a read and 56 times that long (1183 seconds) on a fetch. The bottom two rows show that another SQL statement spent 39 seconds on a read and 35 times that long (1370 seconds) on a fetch. That’s an awful lot of fetching for not much reading. Clearly, there’s room for improvement.
Analyzing wait time reveals important baseline metrics you’ll need in MySQL performance tuning. In this case, the focus is on the big difference between rows examined and rows sent. Average wait time itself is another useful metric. Baseline metrics allow you to set a tuning target, when you can say, “That’s good enough.” Then you move on to the next performance problem.
Tip 2: Review the execution plan
The execution plan reveals the cost of each operation. That helps you find the most expensive steps, such as I/O (rows examined, rows sent), full table scans, index scans, filtering predicates and column data types.
MySQL gives you several options for generating an execution plan:
- Run explain from a command prompt.
- Running EXPLAIN FORMAT=JSON generates a JSON-formatted explain plan with extended and partition information, plus detail on the operations including which part of the key was used.
- SET OPTIMIZER_TRACE=”ENABLED=ON”; puts the trace in memory to write information to the optimizer_trace table in information_schema. It captures the costs of all the operations that the optimizer considered for the current plan (version 5.6.3 and above).
- MySQL Workbench offers a graphical view of the plan, shown below.
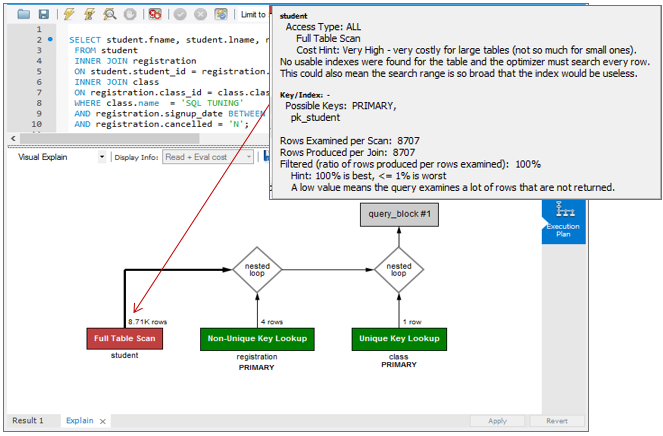
That execution plan shows table name, type of data access, references and the number of rows that the optimizer estimates it will examine when it runs — all useful in MySQL performance tuning.
In general, the earlier in your query that you apply filtering predicates, the less data you discard later. The execution plan makes it easy to see how early or late your query is applying filters. Does your query launch any temporary or filesort activities? If so, the execution plan shows you where they occur so you can try to reduce the amount of data you’re sending to them.
Note the Cost Hint that MySQL Workbench displays (gray box above), advising you that the full table scan on student can be an expensive operation.
Tip 3: Gather object information
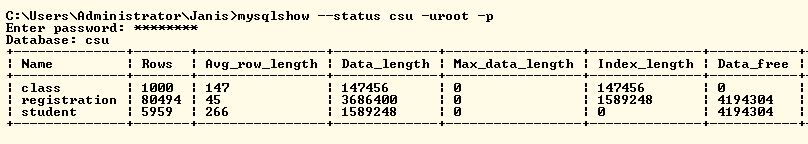
Next, you’ll want to know as much as possible about the underlying tables in a query. Useful information includes table size, whether it’s really a table or just a view, the cardinality of columns in where clauses, and the use of wildcards and scalar functions.
A quick way to gather that information is the mysqlshow –status command.
To review indexes and constraints, run show indexes.
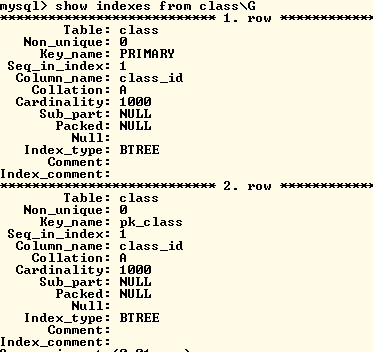
That shows you which columns are in the index, especially the left leading column in a multi-column index.
Can the query even use the index? If your query applies functions on an indexed column, the optimizer won’t use the index at all, and you may need to rewrite the query.
Review the existing keys, constraints and relationships. For queries that join many tables, create an Entity Relationship Diagram (ERD) that shows you how the tables are related to one another.
Tip 4: Find the driving table
Your goal in MySQL performance tuning is to drive the query with the table that returns the least data. In other words, you compare the number of rows in the final result set to the number of rows the query examined.
Using the driving table reduces the number of logical reads. To find the driving table, you study Joins (Right, Left, Outer) and filtering predicates to figure out how to filter as early in the query as possible.
Below is a partial execution plan for a query in a university billing application. The red operation shows a high number of rows read (more than 8,700) from the student table. In fact, it’s every row in the table, which is inefficient.
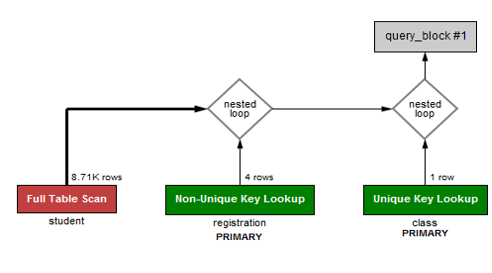
Here is a sample query for all students taking a class called “MySQL Performance Tuning”:
SELECT s.fname, s.lname, r.signup_dateFROM student sINNER JOIN registration rON s.student_id = r.student_idINNER JOIN class cON r.class_id = c.class_idWHERE c.name = 'MYSQL PERFORMANCE TUNING'AND r.signup_date BETWEENDATE_SUB(@BillDate, INTERVAL 1 DAY) and @BillDateAND r.cancelled = 'N';
Using SQL diagramming, you determine that class is the driving table. You run the following SQL to add and view two foreign keys:
ALTER TABLE registration ADD FOREIGN KEY (student_id) REFERENCES student(student_id);ALTER TABLE registration ADD FOREIGN KEY (class_id) REFERENCES class(class_id);SELECT table_name,column_name,constraint_name,referenced_table_name,referenced_column_nameFROM information_schema.key_column_usageWHERE table_schema = 'csu' AND table_name = 'registration'AND referenced_column_name IS NOT NULL;
With the addition of those foreign key constraints, the optimizer chooses a better execution plan using class as the driving table. Although it’s still running that full table scan, several important numbers are improved:
Before foreign keys | After foreign keys | |
| Executions | 28K | 348K |
| Average Wait Time | 114 ms | 4 ms |
| Rows Examined/Sent | 84K/2 | 1.4K/2 |
To send the same number of rows, just 1/60th of the rows (1.4/84) now need to be examined. Plus, the ratio of executions to average wait time is vastly improved.
You may find room for even more improvement, for example, by reviewing your choice of indexes to reduce the number of rows examined. In MySQL you can create a covering index, which includes all the columns in the query. That prevents extra I/O because the index can satisfy the query. Or you can create a partial index, say, on a table containing a large varchar column, where the index would be too large to traverse. MySQL supports indexes on a virtual column, which works similarly to a function index in Oracle, except that the data is stored only in the index.
Note, though, that adding indexes doesn’t always improve performance. Fortunately, MySQL Workbench makes it easy to capture metrics before and after you experiment so you can see whether and how you’ve improved things.
Tip 5: Identify performance inhibitors
Finally, most of the low-hanging fruit of MySQL performance tuning lies in small programming mistakes that have a big impact:
- Cursor or row-by-row processing
- Parallel query processing — Sometimes it’s better to split a complex report into multiple queries and run them in parallel.
- Hard-coded hints allow you to execute the query with the plan that you want to test. But hints can become stale or forgotten over time.
- Wild cards like * may seem handy, but they just generate I/O, add to CPU workload and thrash memory. Beware of SELECT * (often used by SQL generators such as EMF, LINQ and NHibernate) and the missing where clause.
- Implicit data conversions are a mismatch of datatypes between the column and a parameter. They impact CPU consumption and can turn off index usage.
Performance is often hampered by mistakes that database developers introduce when they’re rushing to beat a release deadline and feeling pressure to get new features working. Usually, the mistakes are easy to fix, but it does take time and effort to find them.
Start tuning the performance of your MySQL databases
While the details vary from one database vendor to another, the five main steps of MySQL performance tuning apply:
- Monitor wait time
- Review the execution plan
- Gather object information
- Find the driving table
- Identify performance inhibitors
As a MySQL database professional or developer, you’ll find that the methodical approach described here will help you get the most out of this open-source database.