
Migrating Power BI Service content is an increasingly common challenge. This powerful tool turns unrelated sources of data into coherent, visually immersive and interactive insights. Accordingly, organizations that rely on Power BI need to maintain access to their content through mergers, acquisitions, divestitures and consolidation of Microsoft 365 tenants — which requires smoothly migrating Power BI.
Unfortunately, migrating Power BI components between tenants is not a straightforward process. It is simply not feasible to move a report and its data sources from one tenant to another in a single action. Indeed, Microsoft’s Power BI functionality is designed for administration and management, not for identifying and moving content in bulk, and there are no third-party products to fill this gap.
In an article on Practical 365, I offered a brief overview of a framework for Power BI migration from one tenant to another. It involves a 10-step workflow grouped into four phases, as illustrated in Figure 1. This blog post dives deeper into the first phase, analysis, which includes three steps: inventory, usage and criticality.
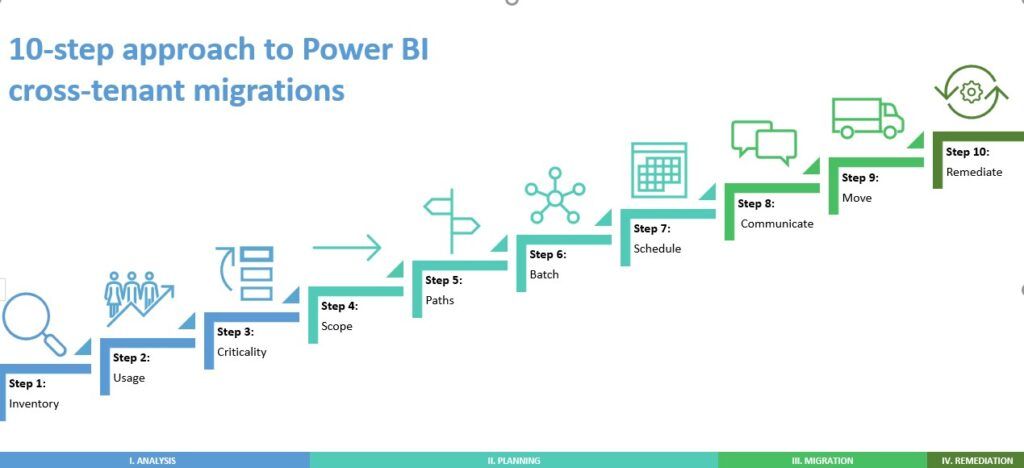
Figure 1: A framework for Power BI cross-tenant migrations
Step 1: Inventory your Power BI data components.
The first step in migrating Power BI is to gather a comprehensive inventory of all the major Power BI data components in the source Microsoft 365 tenant. The Microsoft Power BI cmdlets for Windows PowerShell provide methods to collect data on these components.
At a minimum, be sure to inventory the following:
- Workspaces – Containers for dashboards, reports, workbooks, datasets, and dataflows.
- Datasets – Collections of data that you import or connect to. Datasets can also source data from dataflows.
- Dataflows — Data prepared and staged for use by datasets. Dataflows are optional and are often used in complex or larger projects to unify data from disparate sources.
- Reports — A set of charts, maps, treemaps and other visualizations. All the visualizations in a report come from a single dataset.
- Dashboards — A canvas that contains tiles (described below) and widgets.
- Gateways — Bridges that provide quick and secure transfer of on-premises data. Gateways have their own layer of administration permissions, so while gateways can be discovered through an inventory process, the exact details of their connections can require additional checks with specific admin accounts.
- Data sources — Any of numerous data repositories that the Power BI service can connect to.
- Sensitivity labels — Labels from Microsoft Purview Information Protection (previously called Microsoft Information Protection), which cause a higher level of security to be applied to sensitive content. In the case of Power BI, these labels do not restrict access to content but rather cause data being exported to be encrypted.
- Users & access — Required to ensure that user and guest accounts are migrated to the target tenet and granted access to the appropriate BI content.
The two items listed below can’t be inventoried directly because they are components within a larger container, such as a report or dashboard. However, with some exceptions, these items are transferred when their container is copied.
- Workbooks — A connected Excel spreadsheet workbook that feeds active data into visualizations.
- Tiles – A snapshot of data that is pinned to a dashboard. A tile can be created from a report, dataset, dashboard, the Q&A box, Excel, SQL Server Reporting Services (SSRS) reports and more. Entire report pages can also be pinned to a dashboard as a single tile.
Step 2: Understand Power BI usage.
With your inventory for migrating Power BI in place, the next step is to determine three key utilization indicators: how much Power BI is being used, who is using it and what the licensing assignments are.
How much Power BI is being used?
Two logs contain a complete copy of the Power BI auditing data:
- Audit log — Global administrators can analyze activity across multiple Microsoft 365 services using this log. Activity in Power BI has the “PowerBIAudit” record type. This log spans 90 days.
- Activity log — Administrators can analyze usage for all Power BI resources at the tenant level using custom reports based on this log. Global administrator access is not required to read this log, and the data is filtered for Power BI. However, the activity log is limited to 30 days.
Note that retrieving these logs can take 30 minutes or more.
Who is using Power BI?
To determine which users have signed into Power BI, administrators can use the Azure Active Directory access and usage reports. To access the sign-ins log, you need to be a global administrator or hold one of the following roles: Security Administrator, Security Reader, Global Reader or Reports Reader.
Note that the Sign-ins report does not identify the type of license for each user; for that information, use the Microsoft 365 Administration Center or PowerShell.
What the licensing assignments are
Third, you need to analyze the licensing of both the source and target tenants to ensure you have enough capacity for migrating Power BI without interruptions or delays.
Microsoft offers both per-user and capacity-based licenses for the Power BI service:
- Per-user licenses — There are three kinds of Power BI per-user licenses: Free, Pro and Premium per user (PPU). Which type of license a user needs depends on where content is stored, how they’ll interact with that content and whether that content uses Premium features.
- Capacity-based license — A capacity-based Power BI Premium license (also called a Premium subscription) gives organizations a monthly flat-fee option that delivers auto-scaling for high consumption usage without any per-user license costs. This makes it an attractive choice for enterprises with many users who utilize Power BI extensively.
To ensure a smooth transition when migrating Power BI, be sure to answer these questions:
- Which license types are assigned in the source?
- Is there enough per-user Pro or Premium licenses available to absorb the new population into the target?
Step 3: Determine the criticality of each component.
The final step in the analysis phase for migrating Power BI is to determine which workspaces, reports and data sources are critical to business operations and therefore need to be moved to the target tenant.
While the utilization data collected in the previous step will help you understand what content is being used, it cannot tell you how important that content is to the organization. Just because a report was accessed a lot over the last 30 days does not mean that it is business-critical; it simply shows that the report was useful during the past month. The project associated with the report could be completed next week, possibly making the report obsolete by the time you begin migrating Power BI.
Accordingly, it’s vital to get input from the owners and users of the BI content. Options include not just interviews but also survey apps like SurveyMonkey or forms in Microsoft Teams.
Based on the results of your research, revise your inventory to indicate which components will be migrated and which will remain behind. (Later in the process, in step 5, you will decide whether assets that are being left behind require decommissioning or deletion before the M&A deal is complete.)
As you update your inventory, keep in mind that not all Power BI objects can be moved between tenants, for two reasons. The primary one is that the Power BI objects need to be allowed access by the Power BI desktop application; this is necessary for extracting reports even when utilizing PowerShell or the Power BI Service REST APIs. The secondary consideration is that Microsoft do have some known limitations for certain report types that are not available for extraction from the Power BI Service.
Stay tuned!
In my next post, I will cover the planning phase for migrating Power BI.