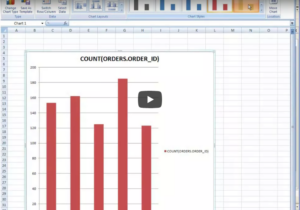
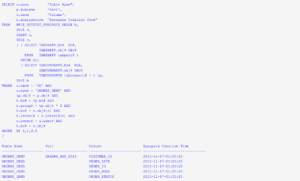
Learn how to create one-click Excel charts of data using Toad Data Point, Quest Software’s solution for finding, understanding, and reporting on data from multiple platforms.
Related Articles
Sophisticated Incremental Statistics gathering feature in 12c
Overview In typical data warehousing environment existence of huge partitioned tables is very common, gathering statistics on such tables is challenging tasks. For partitioned tables there are two typ...
Experts from Computer Weekly and Quest discuss a powerful approach to...
Managing multiple diverse database platforms and hybrid environments has become the new norm for DBAs. But the evolving database landscape comes with its challenges. In this video, Computer Weekly Edi...
Optimizing SQL statements with a VIEW
This tips covers optimizing SQL statements that use a VIEW in place of a TABLE. In early versions of the Oracle database, a VIEW was handled like a temporary table that stores the temporary data from...
