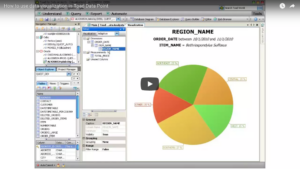
Learn how to build graphical representations of your data using the data visualization feature of Toad Data Point.
Related Articles
Toad Turnpike: Real Stories from the Road – Interruptions Part 2
Real stories. Real people. Doing real things. With Toad solutions. Forget the Training Manuals Part two in my three-part series on how Interruptions can be game changers. You can find part one of t...
Benchmark Factory REST API (Part 1)
As more and more companies try to move to an Agile process for their application development, ways to automate testing has become a popular question we get. How to automate Benchmark Factory testing?...
How to Create a Physical Standby Database using Backup Pieces
In this article we will learn How to create a new Physical Standby using Backup Set and also DUPLICATE in RMAN, this is a fast way to create Physical Standby when to create the Standby using ACTIVE DA...
